We use infographics to help visualize information and data, such as the dashboard in our product interface. The style of our infographics is consistent with our visual identity; we use our corporate colors. When creating infographics, we follow a few simple guidelines.
Our infographics are always:
2D, not 3D;
Simple, clear;
The basic colors from the logo;
Consistent line thicknesses.
7.2
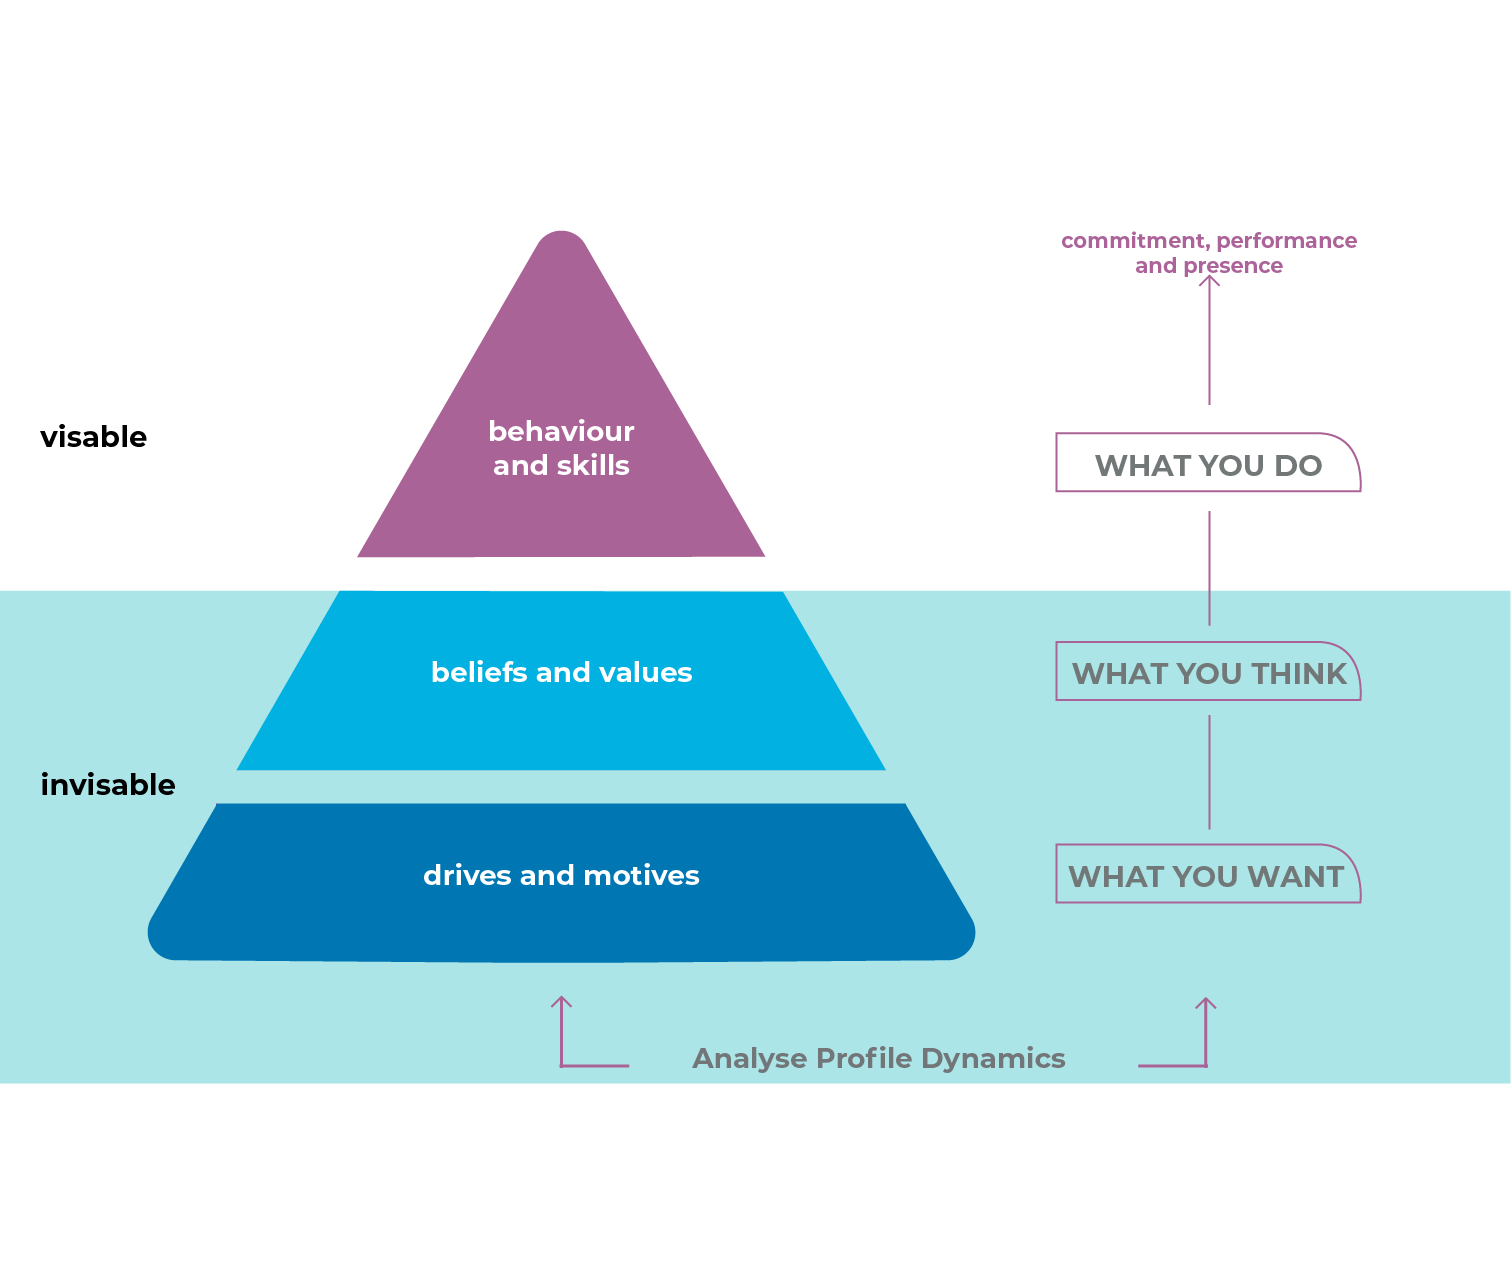
Iceberg model
The iceberg model shows how your motivations and beliefs translate into visible behavior. Understanding drives contributes to self-knowledge, promotes mutual understanding and cooperation, and makes policy more effective.
7.3
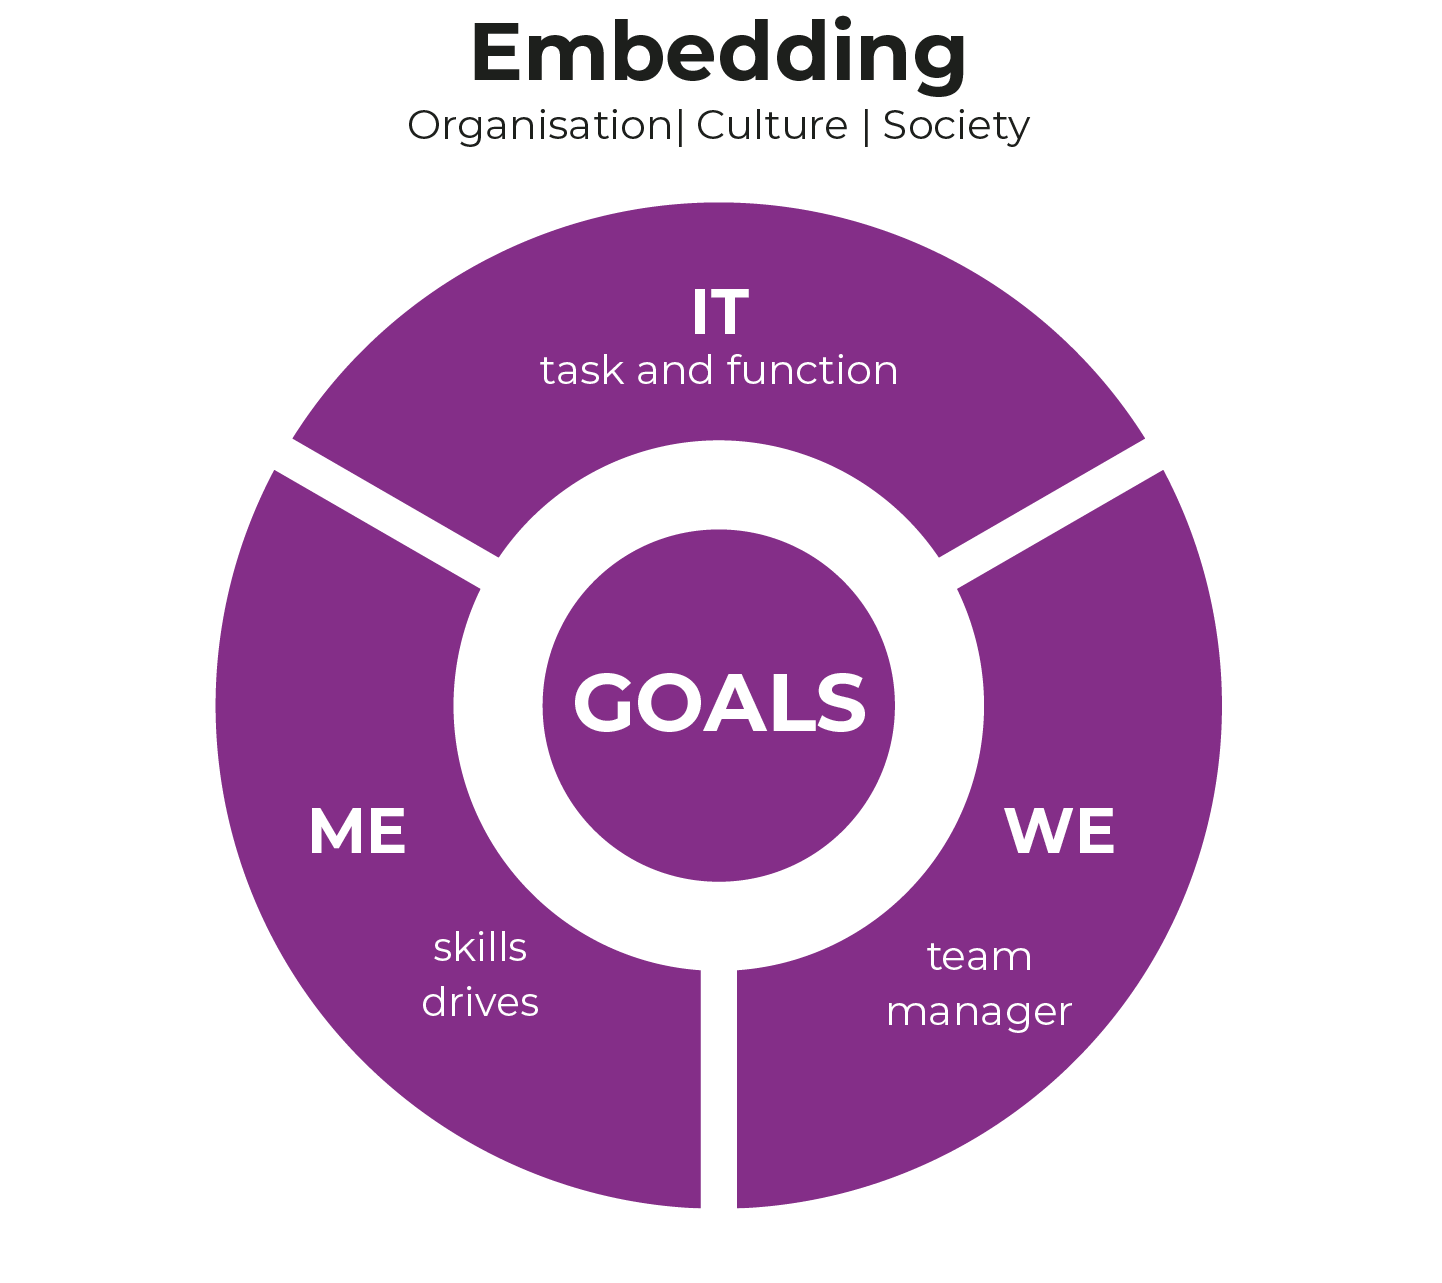
Congruence model
The congruence model shows that people perform best when all elements are in balance and their work and environment match their motivations. This model allows you to focus on (preventing) bottlenecks and take targeted measures to solve problems.
7.4
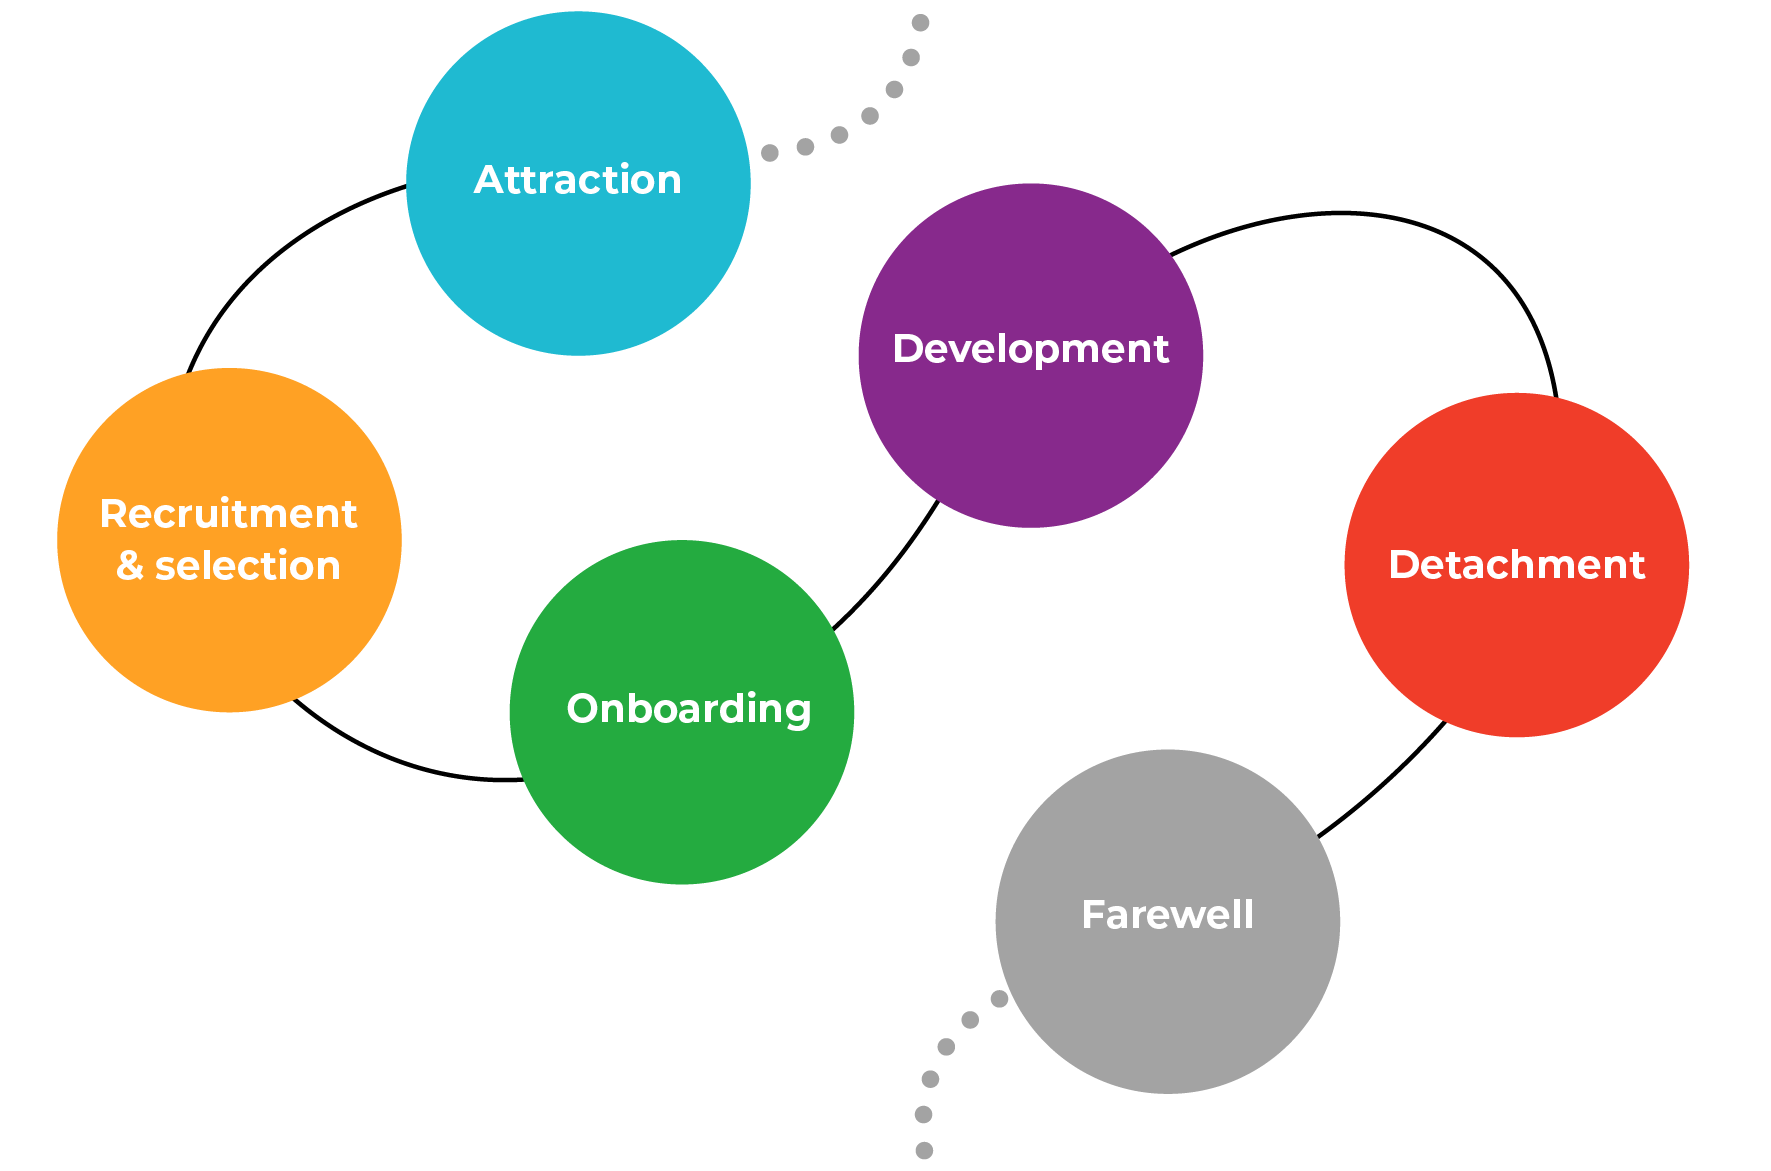
Employee life cycle
The employee life cycle shows the (mental) stages an employee goes through in their contact with an employer, from initial introduction to departure from the organization. Using motivators, you can establish better contact with the employee at every stage and better align people and work.
7.5
Individual profile
The individual profile shows what motivates people in their work (above the line) and what costs them energy (below the line). This insight helps people find work that suits them and improves their performance.
7.6
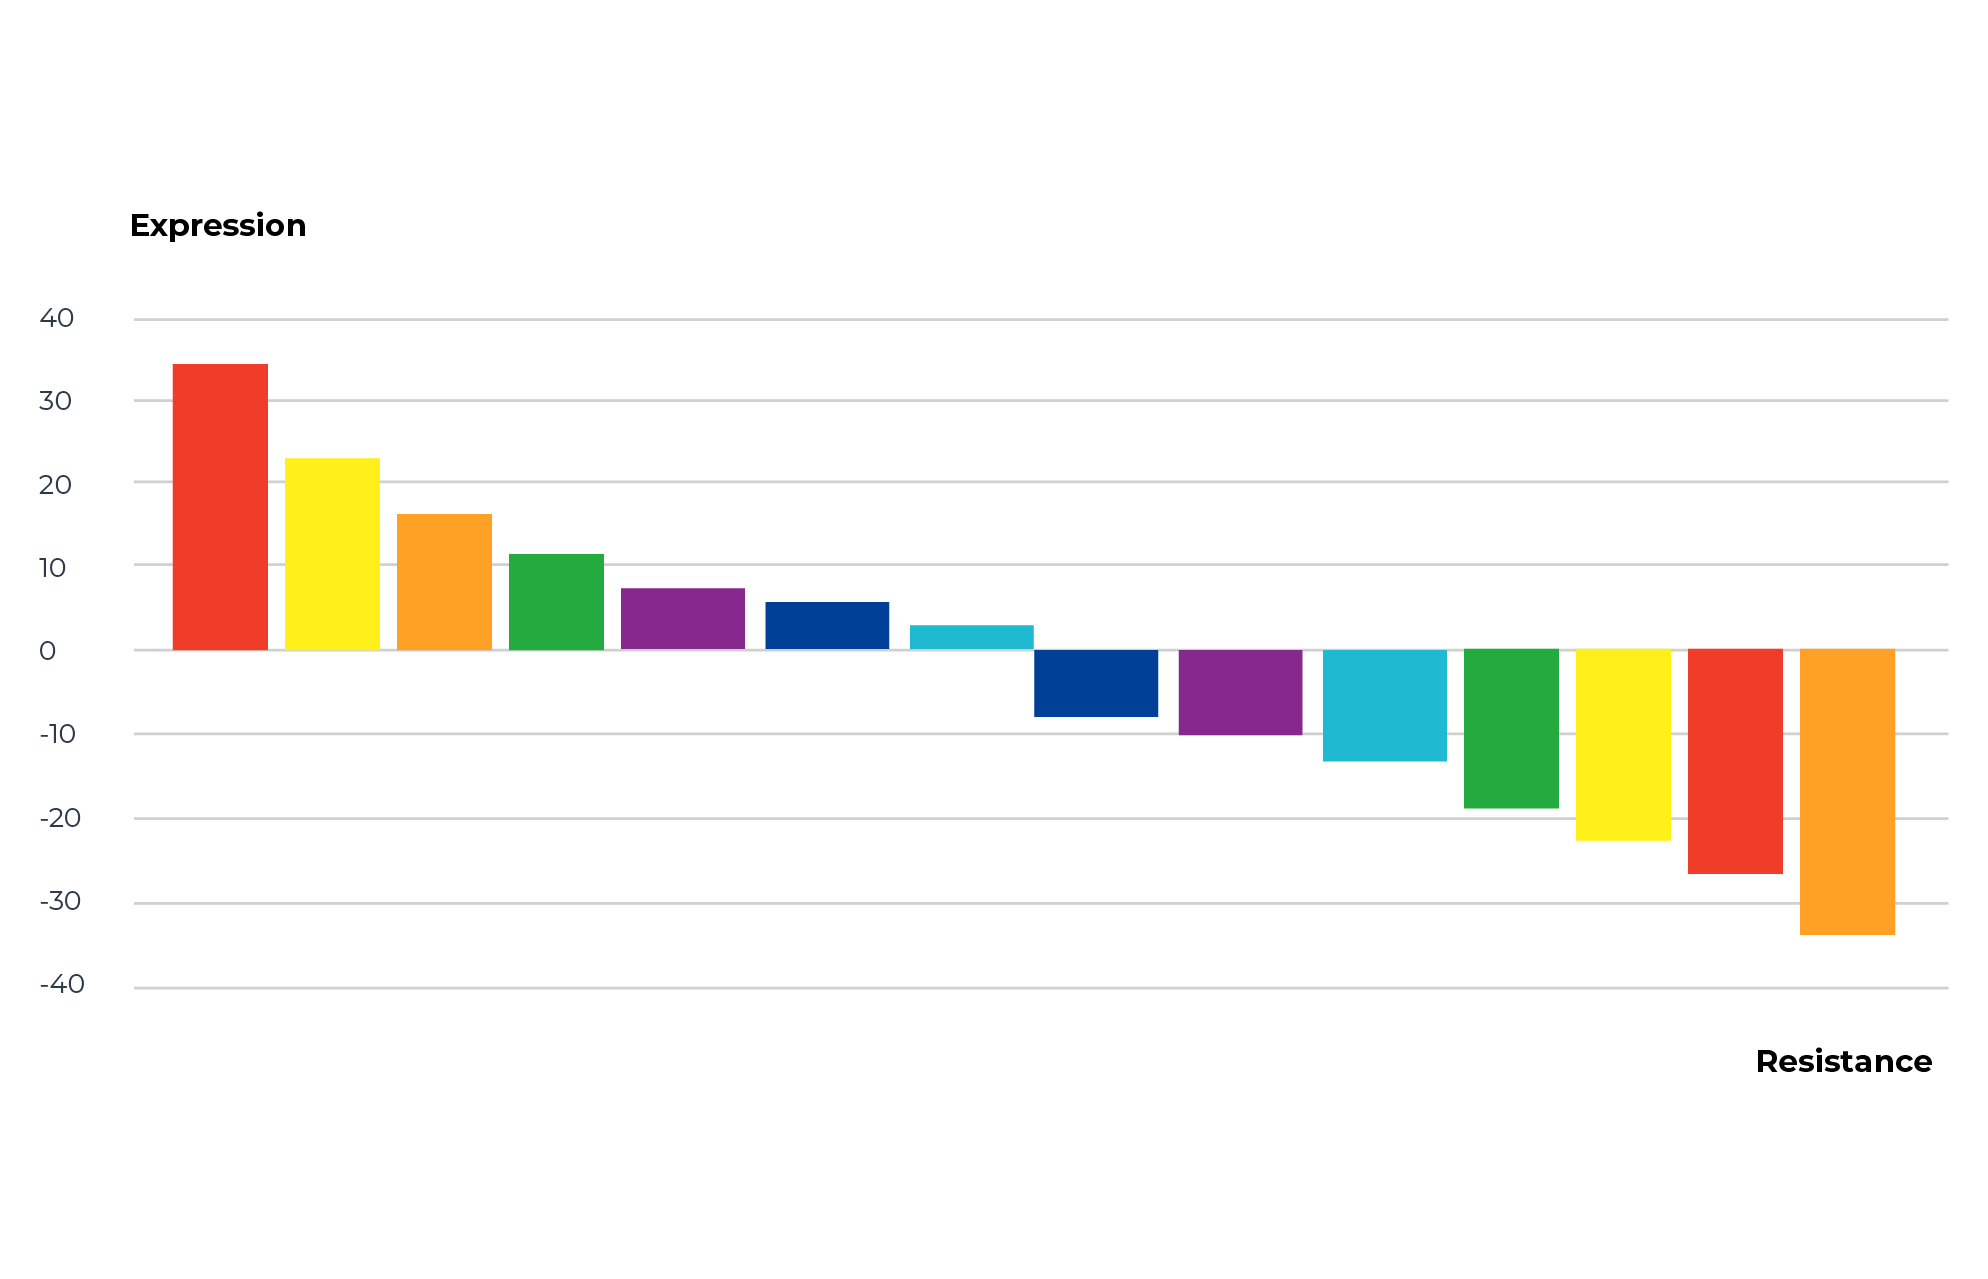
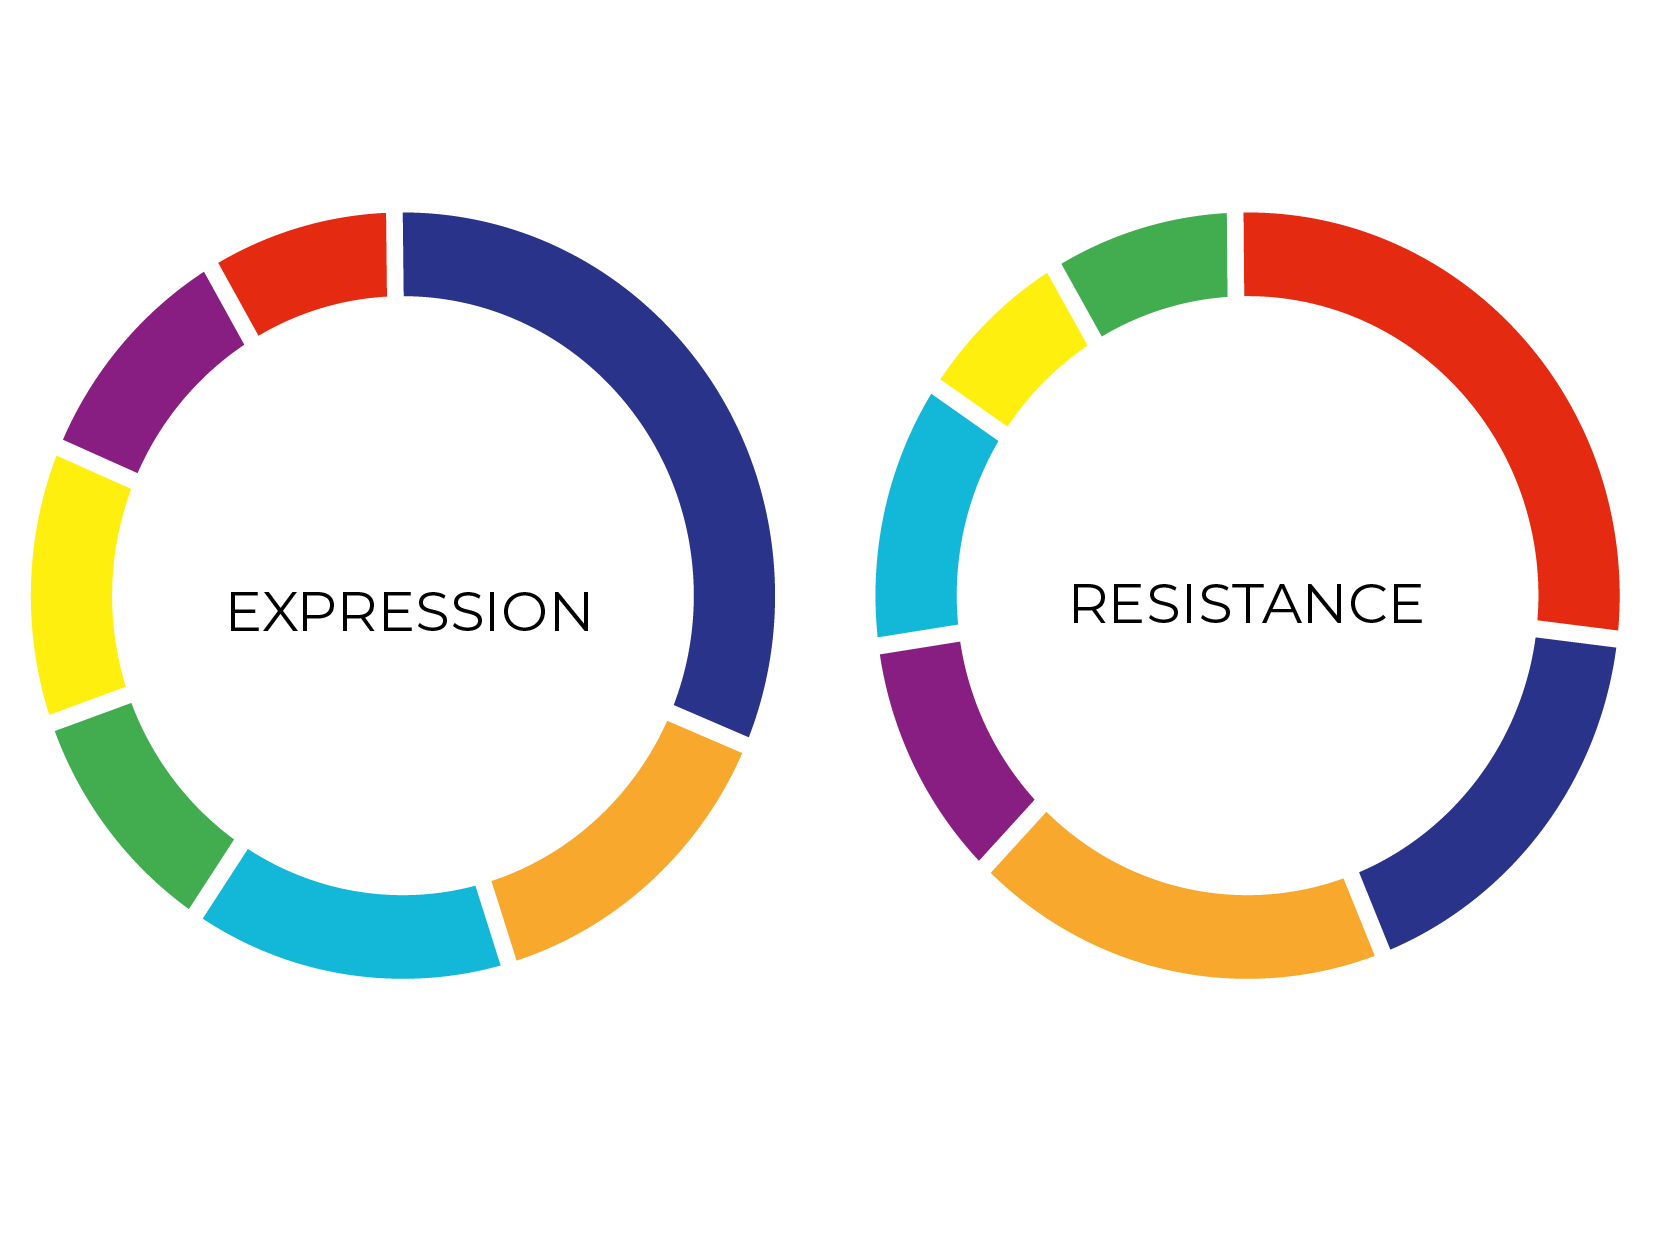
Team profile
The team profile shows what motivates the team to excel (expression) and what inhibits their energy (resistance). It clarifies where the team's strengths lie and how you can adjust them.
7.7
Job profile
The Job Profile shows which motivators contribute positively to the position and which resistances are appropriate for the environment and can be 'read' as the profile of the 'ideal candidate'. It is a useful tool for quickly getting to the heart of the matter and finding the best match between job and candidate.
7.8
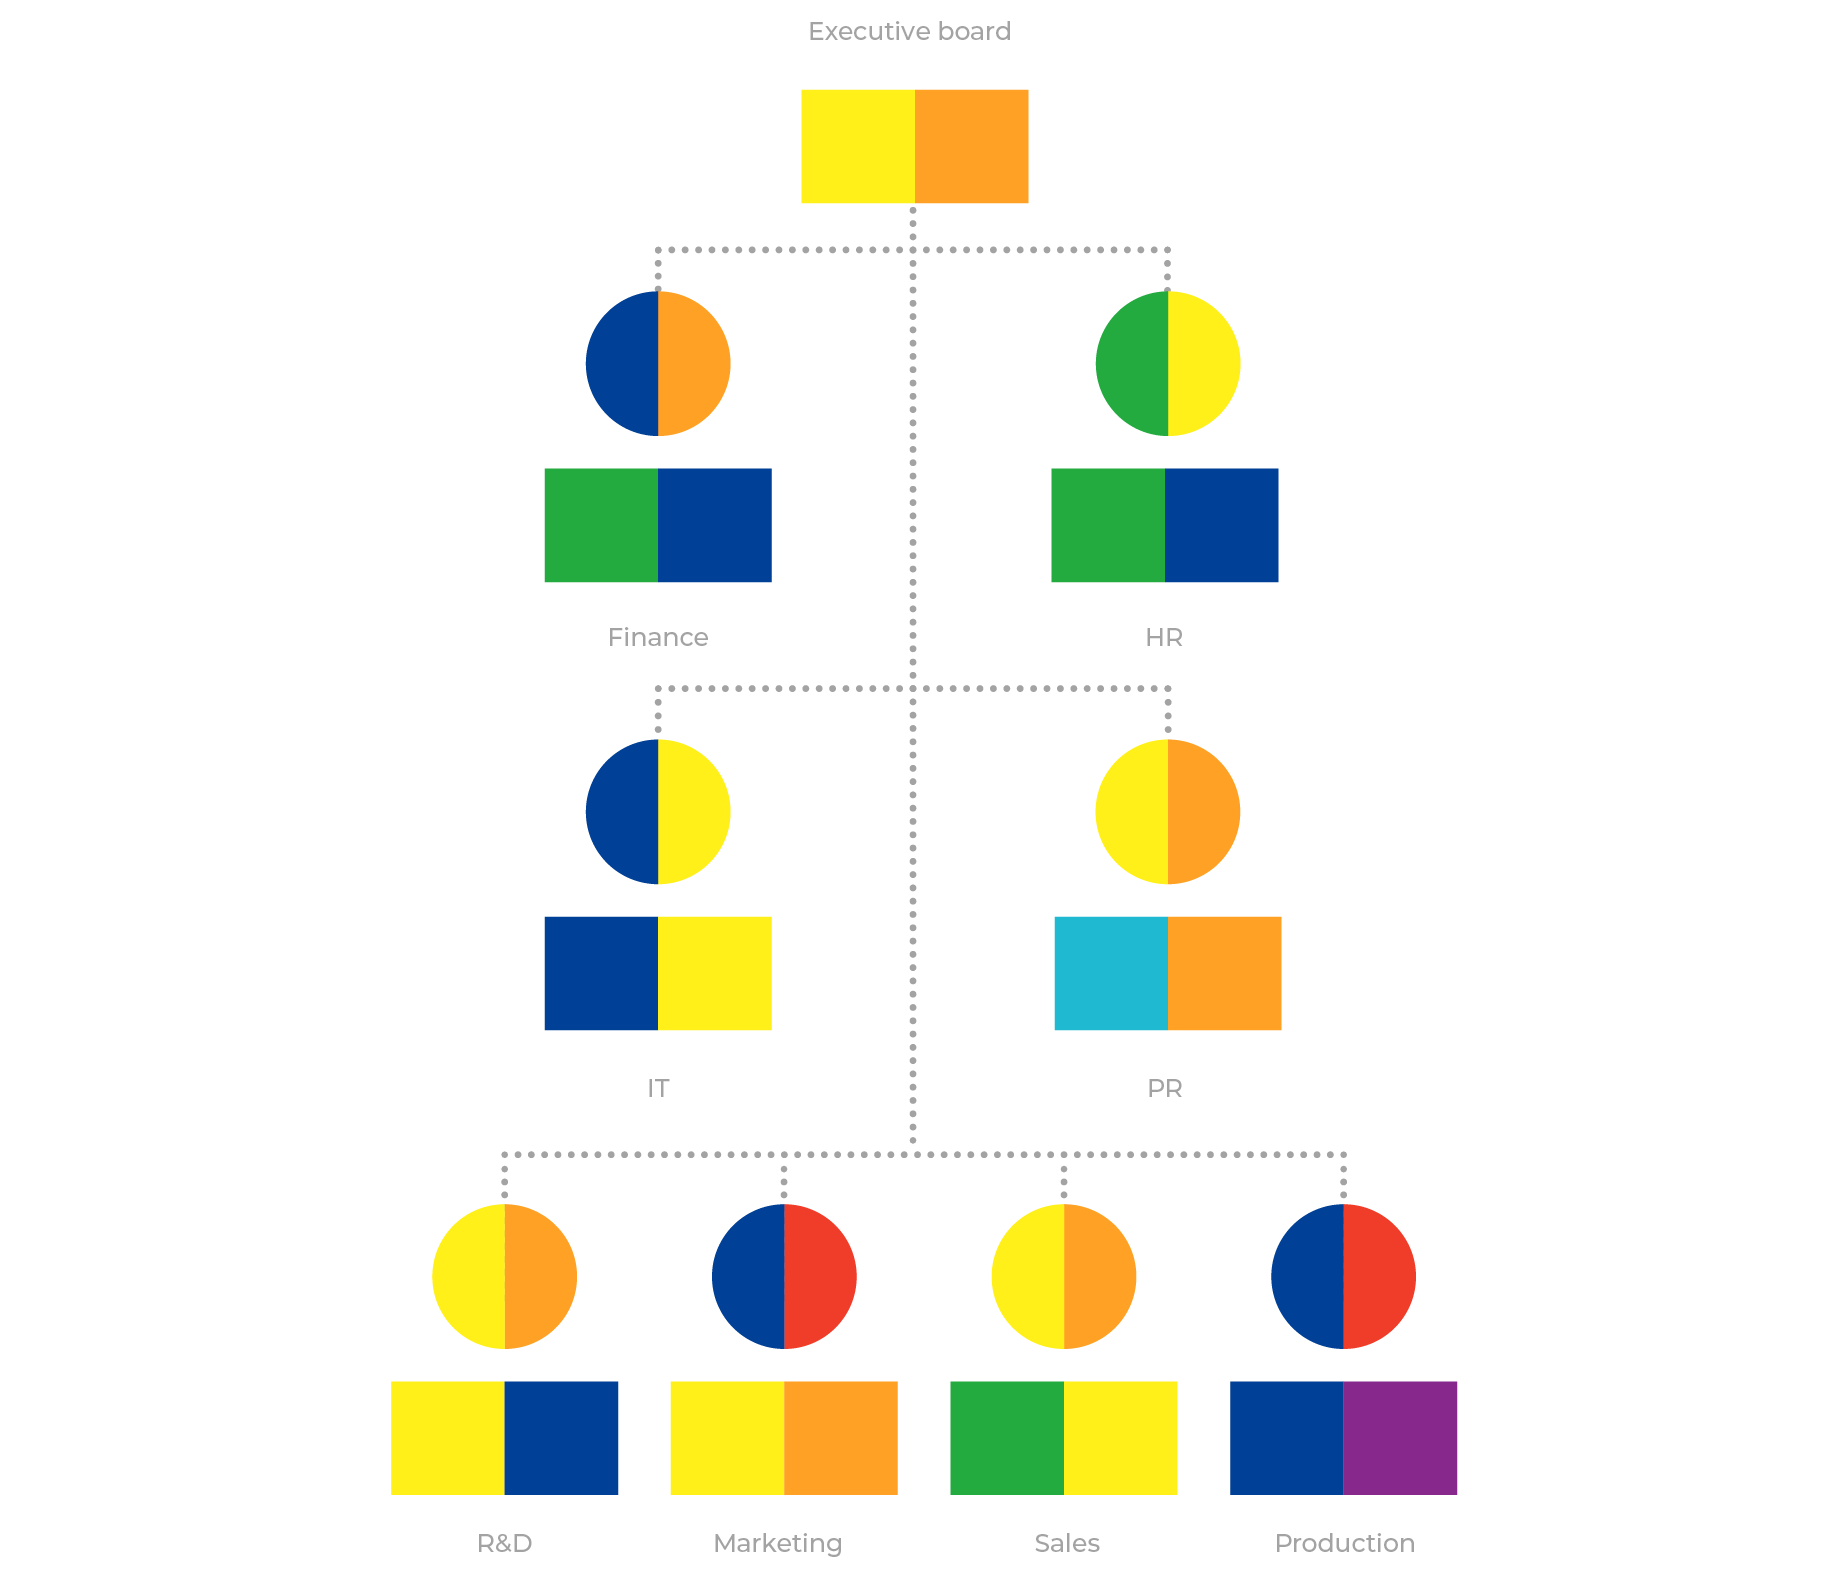
Organizational overview
This organogram shows the motivators and cultures in the organizational departments and in key positions. At a glance, you can see how the cultures fit in with the work, how they are interrelated, and where the bottlenecks are.
7.9
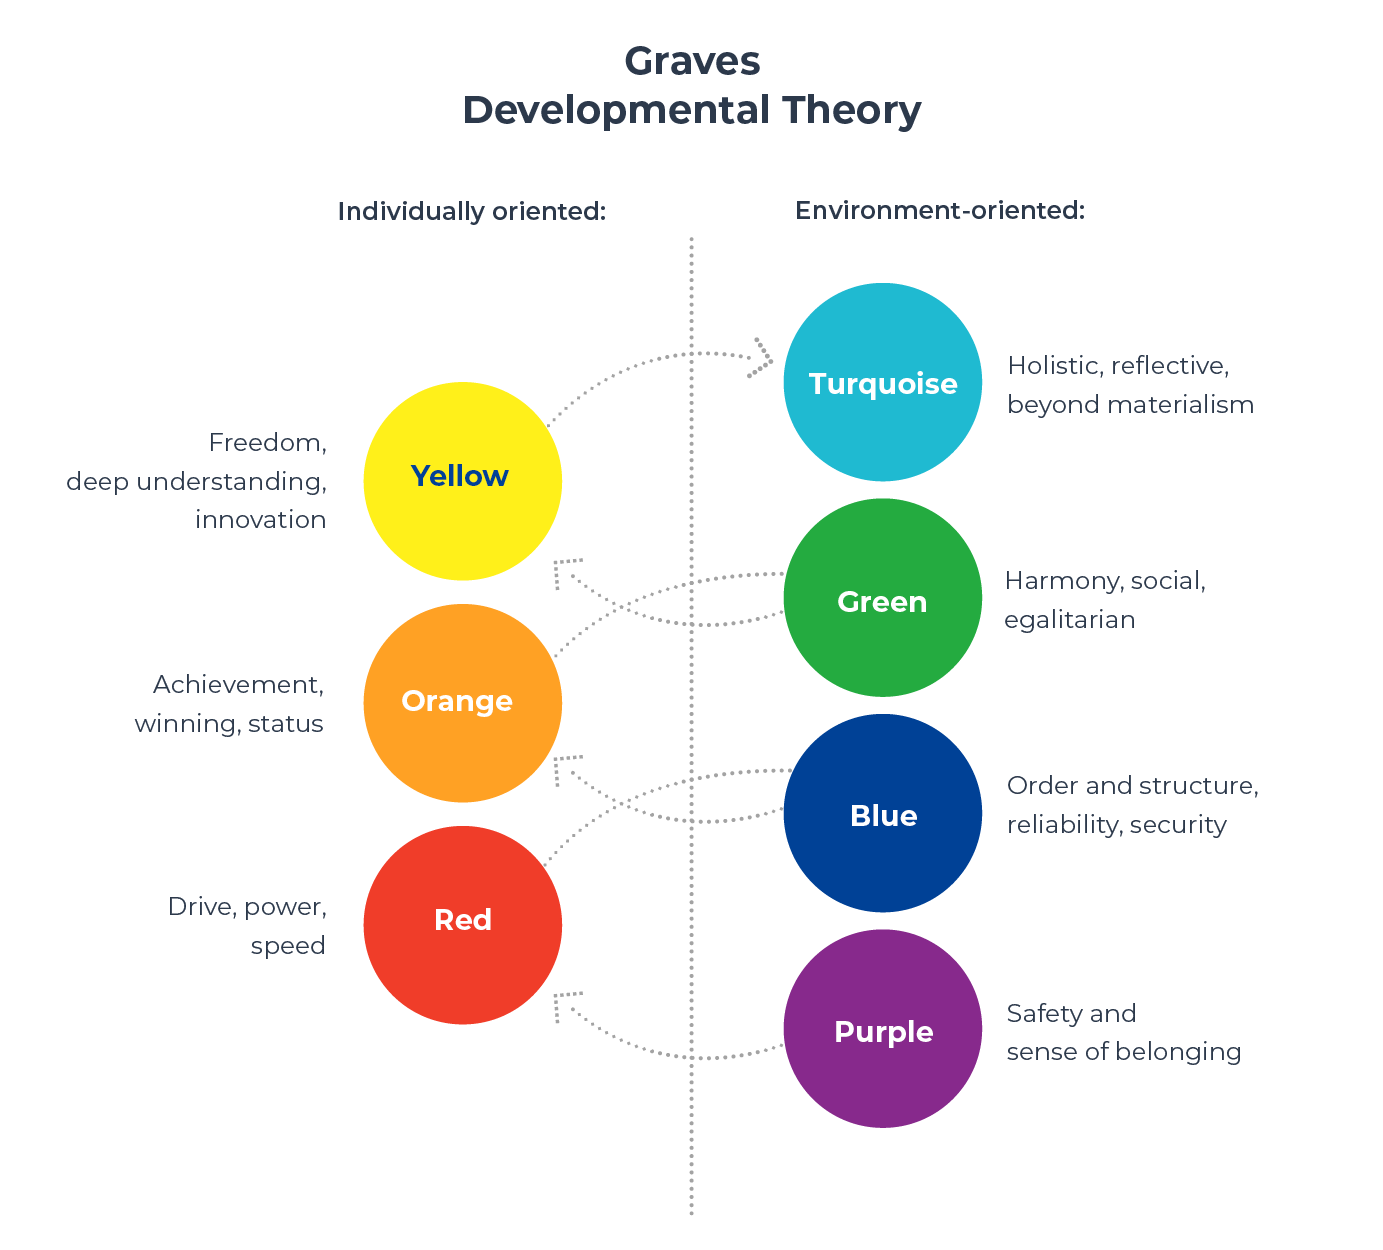
Graves-Spirale
The spiral shows how people and cultures develop according to Graves' theory. This model forms the basis for Profile Dynamics motivators and motivator cultures.
7.10
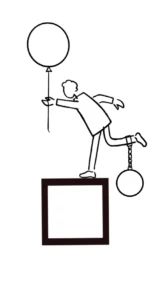
Illustrations
The employee life cycle shows the (mental) stages an employee goes through in their contact with an employer, from initial introduction to departure from the organization. Using motivators, you can establish better contact with the employee at every stage and better align people and work.